
Welcome back! Now we know what an economic recession is – if you are wondering what the heck I am talking about, it means you have not read Part 1 of this article.
Last time we had a chance to learn that governments and establishments understood that in order to control the market, the perception of people needs to be managed. This theme will be woven in between the lines, so pay attention.
So, we will present a further outlook and more facts until the summary, where all the facts will be put together to amalgamate a better understanding beyond headlines.
The Recession Thesis for 2024

Things are terrible, but not all things are bad. Yet, some of us see cracks in society, some silent open secret that nobody wants to talk about even though everyone knows about it.
To restrict my consideration to explaining how the whole economy works, we will implicitly reduce it. Any economy, even a global one, is a complex system of inputs and outputs. There are some rules governing some aspects of it, like financial regulations or laws set by politicians that affect real-world manufacturing and vice versa. The decoupling and quantification of all its components de facto is nearly impossible. Therefore, economics divides its approaches into two more systematic subfields.
In short, macroeconomics looks at the “big picture” of the economy, while microeconomics focuses on the “small picture” of individual economic units and markets.
We will use those lenses implicitly to build a narrative of why the US, and thus the global economy, might be heading for a recession this year. We already touched upon the topic of inflation and other leading economic indicators. So far that outlook is grim.
So the topics that will need to be covered are the job market, interest rates and if interests then, so are credit markets and property markets. However, today we will focus on the inverted yield curve and what it does imply in our case.
Inversion of Yield Curve: Recession is Coming
Meaning of Inverted Yield Curve
Inverted curve is a sign that investors are perceiving economic slowdown, at least that’s how it is understood. This phenomenon implies that yields for short-terms bonds are higher than for long-term ones.
Hold on Maciek! What does that even mean?
I am glad you asked. So I will walk you through the sequence of: what bonds are, yields, maturity, relation of value/yield, and eventually to the yield curve and inversion itself. Only then we will understand the premise of how it relates to economic recession.
How to Understand Good Old Boring Bonds
Bond — a loan; an “I own you” document; an agreement to repay money with interest in time. Although some companies can issue a type of bonds, most commonly they are referred to as a coupon of a promise to see your money back with reward from a government. These are also called promissory notes, securities, treasury bills (t-bills) or gilts, at least in the United Kingdom.

So, a bond is a loan made to a government for a given amount of monies for a fixed period of time at a typically fixed amount of reward. This reward is called “yield” and it is the interest rate of the income one will earn per each agreed period. These periods vary on the type of the bond, and can be monthly or even annually for shorter and longer bonds’ durations, respectively.
Once a bond reaches its maturity, or the end its duration, the issuer will repay the bondholder the full value. The yield is typically expressed as a percentage, which is a ratio of future earnings to the amount of monies allocated for the time of that loan/bond.
Bonds Value to Yield Relation
So, the key to understanding this is to get over the inverse relationship between value and yield. This relationship exists because of the fixed nature of bond return from its inception to its maturity. Thus, the yield is calculated based on the current market value of a bond in relation to its fixed value at maturity.
To grasp this relationship, let’s use a simplified example. Imagine you buy a 1-year bond from the government for $1’000 with an annual yield of 10%. If you hold the bond to maturity, you will earn $100, regardless of its price.
Let’s consider three scenarios:
- No change: $100 coupon / $1’000 value = 10% yield
- Value dropped: $100 coupon / $800 value = 12.5% yield
- Value increased: $100 coupon / $1’250 value = 8% yield
Another key to understanding this is the fact that these instruments are traded on the market, causing their prices and yields to fluctuate. Banks and financial institutions use these relationships to manage their risks and balance their portfolios, aiming to smooth out their investments throughout the economic cycles.
Keep in mind that even small changes in yield can result in significant changes in the value of each bond, especially when they are traded in large volumes. The relationship between yield and value is influenced by various factors, such as:
- Interest Rates: when central banks try to adjust the money supply.
- Inflation: as it diminishes the real value of the coupons, especially important in longer terms.
- Credit Risk: whether the issuer will pay it back, or even the perception of its stability.
- Supply and Demand: the market conditions and expectations.
Implications of an Inverted Yield Curve
The last piece to this puzzle is the yield maturity curve, or simply “Yield curve”. It is a plot of market yields vs. their duration, which varies from 1 month to 30 years.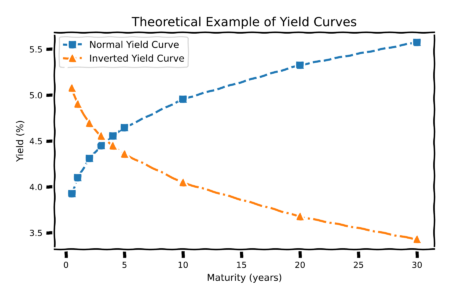 A normal yield curve has an expected shape of logarithmic growth, starting with a low value at the beginning and flattening out at the end for higher maturity. This shape indicates a healthy and growing economy. As would be expected in safe conditions, investors should be rewarded with higher returns for waiting longer and taking on more risk over the years. This implies investor confidence in continued growth.
So, an inverse curve suggests that short-term interest rates are higher than long-term ones. This indicates that investors are placing their funds on the longer side of the curve to safeguard their money for the years ahead. Greater demand for longer-term bonds drives up the price, meaning that with the inverse relationship, the yield decreases.
I highly recommend watching this old yet still informative video from The Wall Street Journal. They succinctly explain that the Federal Reserve (FED) controls the short-term side of the yield curve by reacting to economic fluctuations, such as high inflation. Meanwhile, the right-hand side is mostly influenced by investors, as previously mentioned.
Today’s inversion of the US T-bills
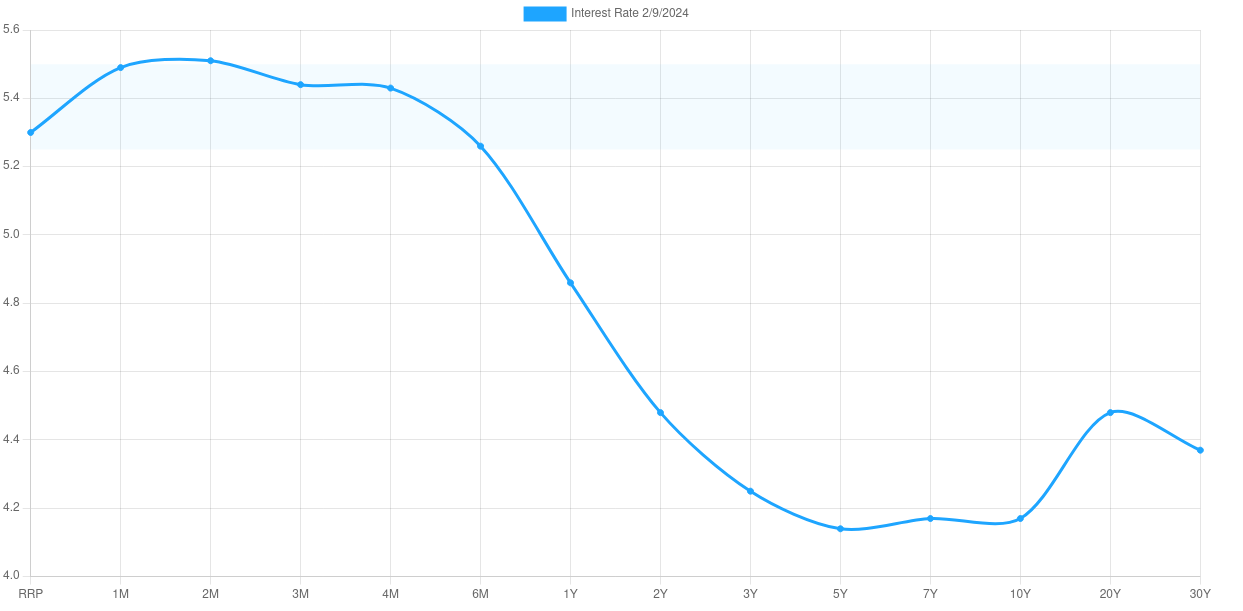
Let’s take a look at the current US treasury bills yield curve. FED target rates are at the levels of 5.25% and 5.5%, shown as the fade blue bounds. So evidently we can see that even today (graph taken on 9 Feb 2024) the curve is inverted. The biggest difference is about 1.37%, which is a historically high level.
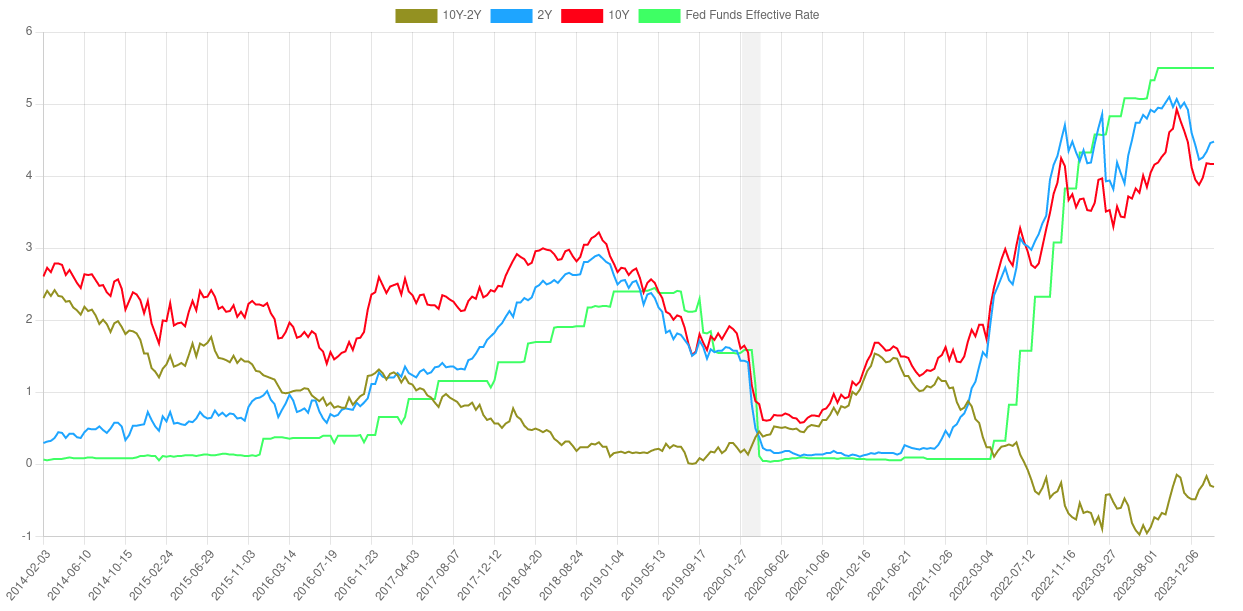
Typically, inversion is depicted as a difference between the 10-year yield and either the 1-year or 2-year t-bill yield. This visualization helps to analyze short-term or mid-term prognosis compared to longer-term outlook. In this graph, we had access to the 10-year and 2-year difference version (grey line), which allowed us to display each of the yields over time separately. As expected, when the FED started raising interest rates (green line), the 2-year t-bill yield (blue line) grew beyond the 10-year one (red line).
Forthose who want to go deeper into the rabbit hole, there are a few other aspects I will only glance over here. Historically inverted yield curves have only once failed to predict an economic recession, in the mid-1960s. Otherwise, lags between the peak of inversion and recession have varied from a couple of months to less than 2 years in each case. This recession is partially similar to 2006 and 1928. In the case of the Great Depression of 1928, similarly as this time, the stock market was booming, disregarding the inversion. Also, the level of current inversion is as high as in the 1928 recession.
So the current inversion trough occurred in June 2023, meaning that eight months have already passed. If we were to adhere to historical norms, this would leave us with almost a year of lag remaining. Additionally, it’s worth noting that the rate and strength of the FED’s intervention were not typical, with only Paul Volcker in the 1980s implementing a 9% change in a year’s time.
Connecting Some Dots
Meanwhile, as I was writing this part, two significant events occurred. Firstly, the New York Community Bank (NYCB) lost 50% of its value in just one week. Secondly, there was a crash of Signa Holding, an Austrian international development company valued at $30 billion. These two events are directly related to the bond market and FED policies. They are just cracks in the facade of “everything is alright, nothing to see here.”
We have learned that an inverted yield curve can provide us with warnings on several occasions. However, what is concerning is that it exhibits some characteristics of the Great Depression. Given this knowledge, it’s essential to find ways to prepare and take advantage of what’s about to come.
The FED has been postponing action for some time now, and they may continue to do so for a few more months. However, if they are so confident that the economy is strong and healthy, why did they announce a reduction in interest rates? Isn’t it true that in the Keynesian model, this is done to stimulate the economy? So, why do we need to “stimulate” it again?
I hope we will be able to answer those questions in upcoming follow-ups. What is your take on the current state of the economy? Do you know any anecdotes or insights worth sharing?